What is Structured Analysis? Data Flow Diagram(DFD)

Structured analysis and DFD Structured analysis is a set of techniques & graphical tools that allow the analyst to develop a new kind of specifications that are easily understandable to the user.
Structured analysis method focuses on what the system or applications does rather than on how it is done. Thus the focus is on logical rather than physical aspects of the system.
Goals/Objectives of Structured Analysis
- Use graphics wherever possible to help communicate better with the user.
- The focus is on logical rather than physical aspects of the system.
- Involve the users as much as possible in the development of the new system & in the evaluation of all plans & proposals.
DFD(Data Flow Diagram)
Data Flow Diagrams are widely used graphic tools for describing the movement of data within or outside the system.
As a DFD consists of a series of bubbles joined by lines, it is also known as ‘bubble chart’.
Characteristics of DFD
- DFD shows the flow of data through the system.
- They focus on the processes that transform incoming data flows (input) into outgoing data flows (outputs).
- The processes that perform this transformation normally create as well as use data.
- External entities supply & consume data from the system.
- Support a top-down approach to analyse.
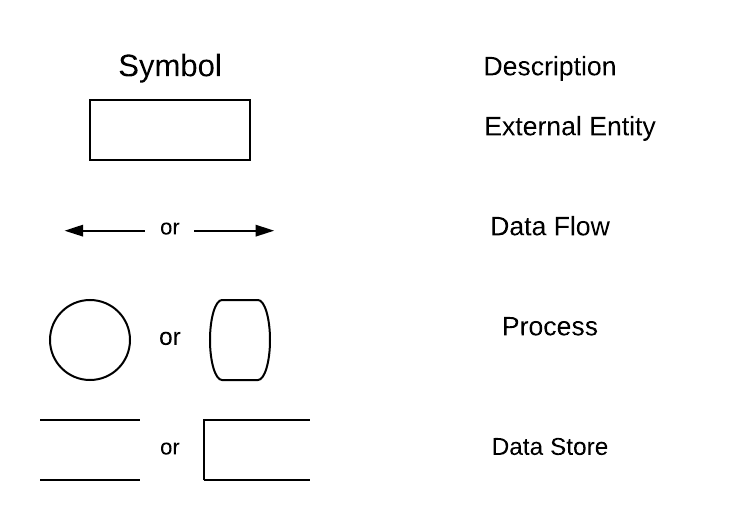
DFD Symbols
In DFD, there are four symbols.
-
External Entities(Source or sink)
An external entity is a source or a destination. These may be people, program, organization or other entities that interact with the system.
Eg. Customer, employee etc.
-
Data Flow
The data flow indicates the movement of data either from input to process or from process to output. Data flow is labelled to show what data is flowing.
Eg. Customer details, sales reports etc.
-
Processes
Processes are the actions performed on input data to produce the output data. They are given some meaningful names.
Eg. Prepare bill, calculate sales, compute pay etc.
-
Data Source
A data store is like a warehouse for data. Data store indicates the data file or register where data is accumulated.
Eg. Customer master file, employee register etc. are data stores.
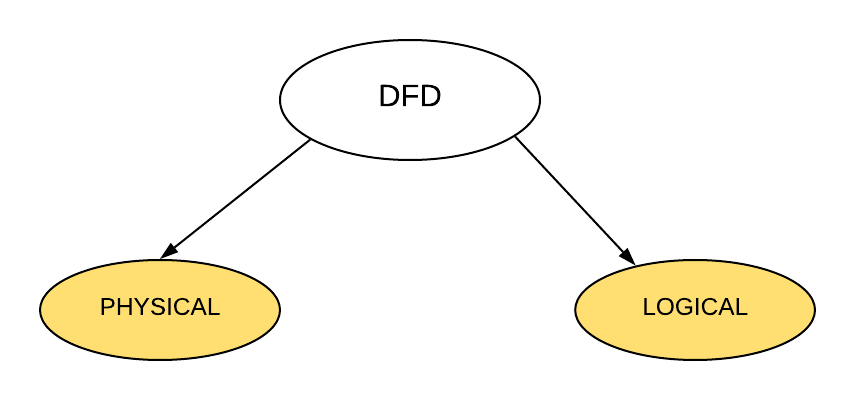
Types of DFD
There are two types of DFDs-Physical DFD & Logical DFD.
-
Physical DFD’s
The DFD which represent the model of the current system are known as physical DFDs. These diagram shows how the system will be implemented including hardware, software, files & people involved in the system.
-
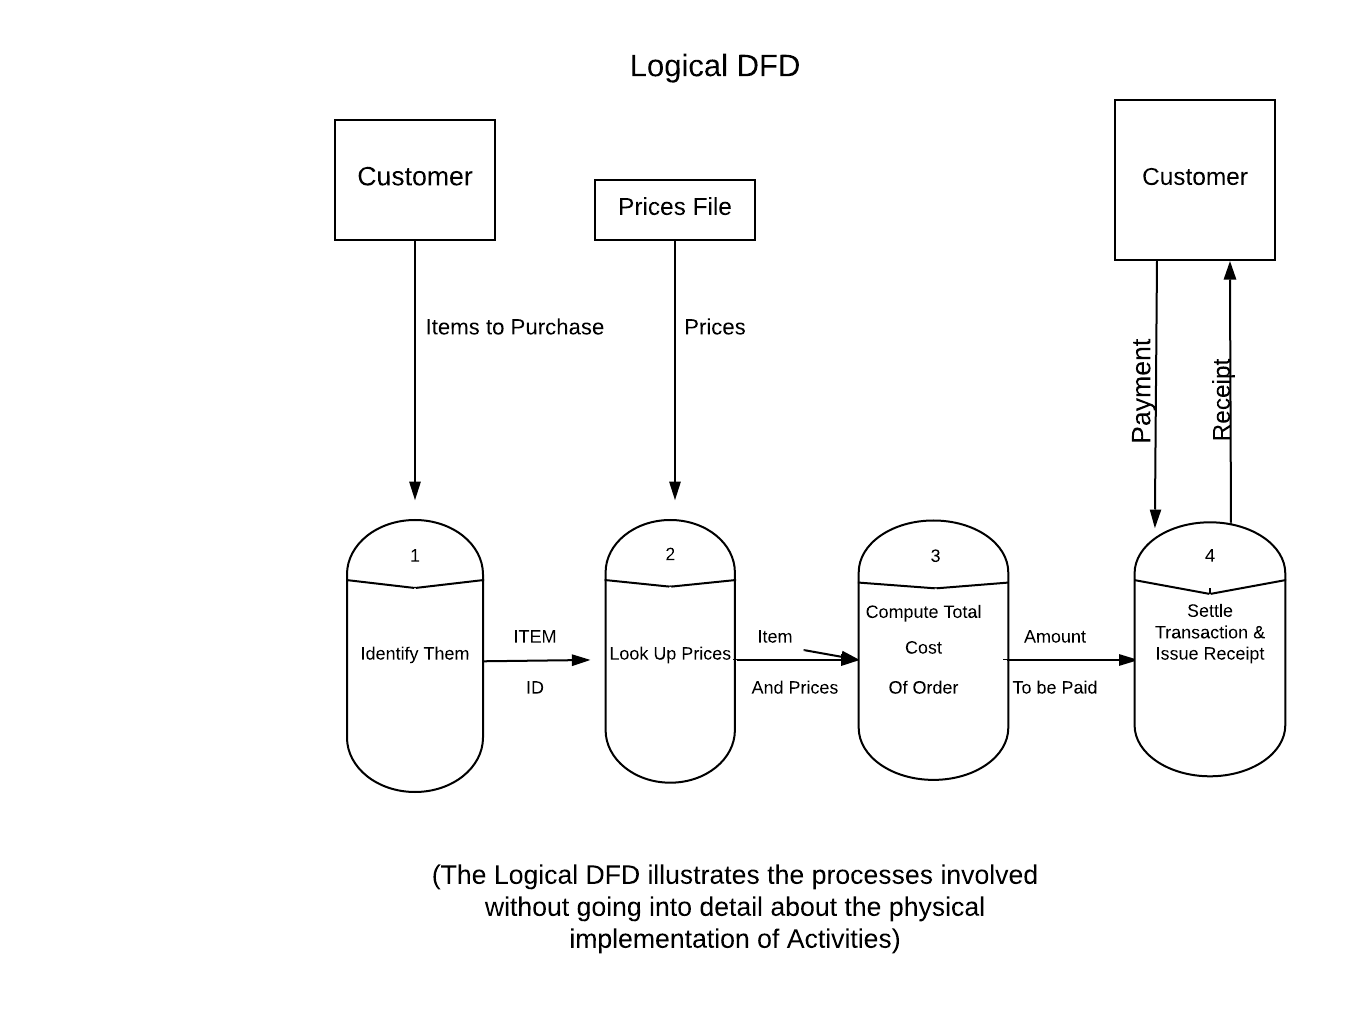
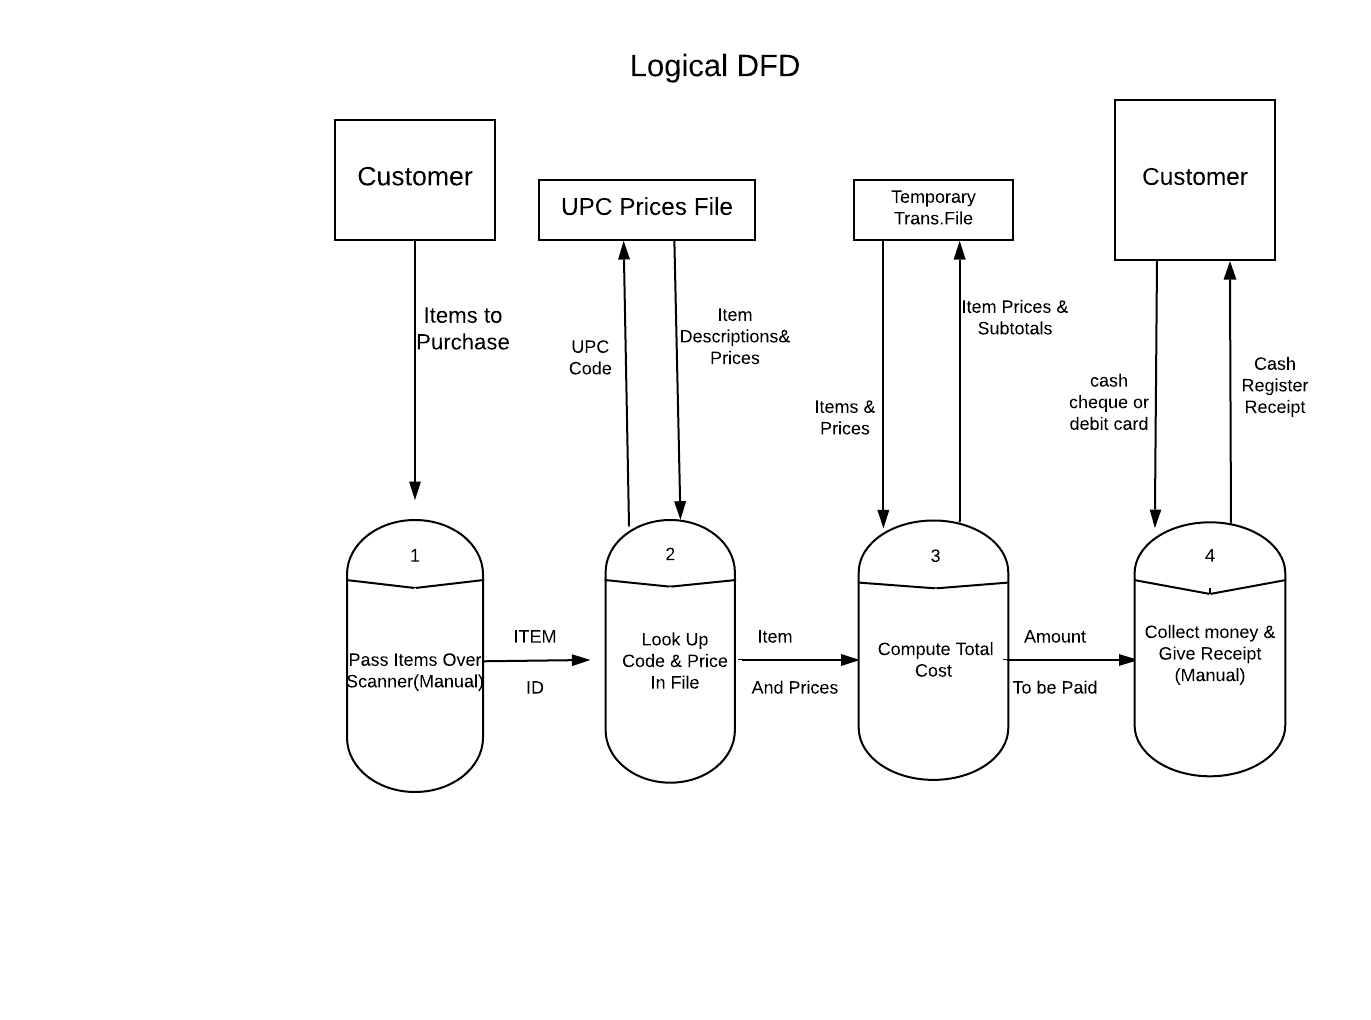
Logical DFD’s
The data flow diagrams which represent the model of the proposed system are known as Logical DFD’s. These diagrams focuses on the business &how the business operates. It is not concerned with how the system will be constructed.
Note
The logical model reflects the business whereas the physical model depicts the system.
The following figure shows the logical & physical DFD for a General stores cashier.
Steps to Construct a DFD
The following steps and rules may be followed while constructing DFDs
- Identify external entities & data flows of the system.
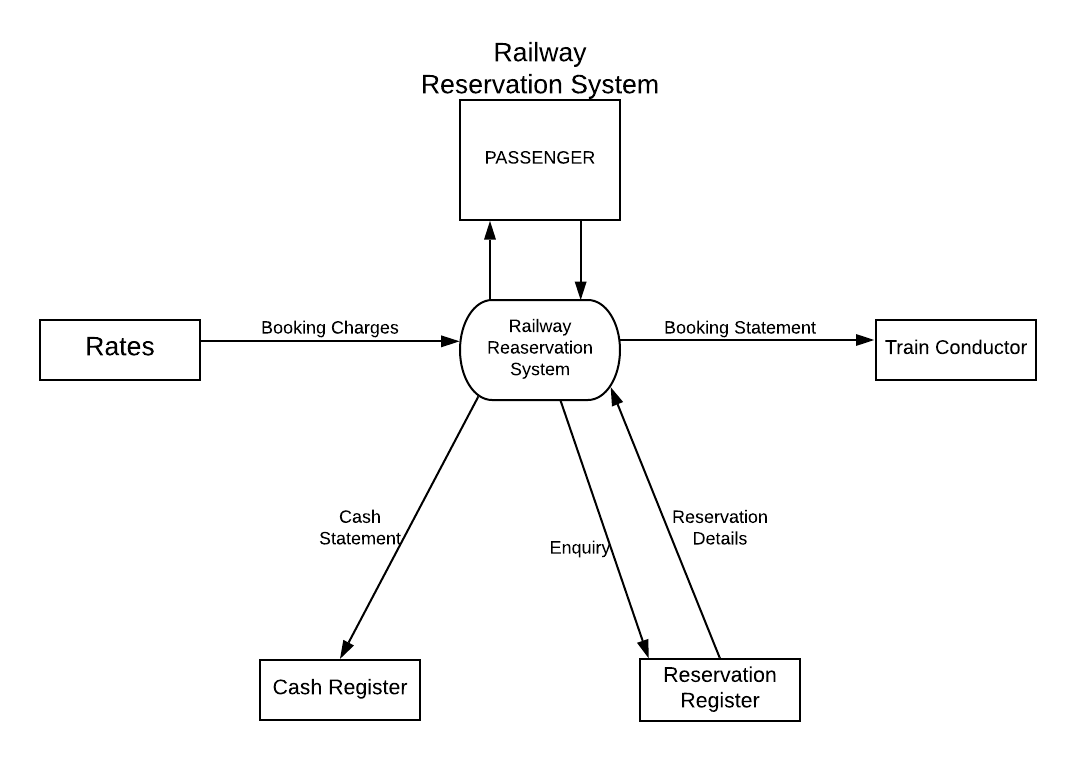
- First construct the context diagram. A context diagram contains a single process.
- Processes in the DFD should be named & numbered for easy reference.
- The direction of flow is from top to bottom and from left to right.
- The name of data stores, sources & destinations are written in capital letters & first letter of each word of process & data flow name should be capitalized.
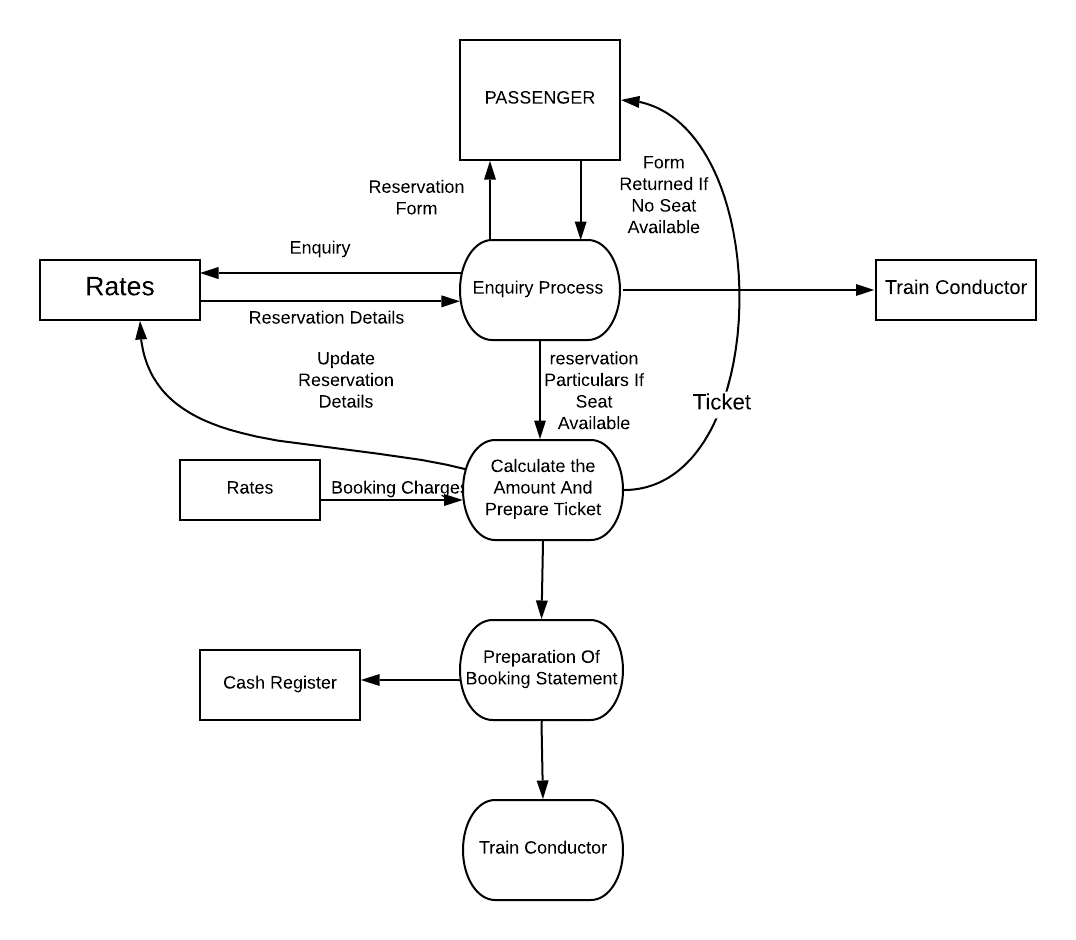
- The description in the context diagram is very brief. Identify data stores & processes of the system & draw first level DFD.
- Explore the processes of first level and draw second level DFD.
- Explore the processes of second level and draw third level DFD and so on.
How many levels of diagrams are needed depends upon the nature of complexity of the particular system.
Advantages of DFD
- DFD is a tool to interact with users.
- Freedom from committing to the technical implementation of the system too early.
- It provides the understanding of the interrelatedness between systems & subsystems.
- Elimination of redundancies & easier creation of the physical model.
- It will be easy to analyse the proposed system if the necessary data & processes have been defined.
- DFD is very easy to follow errors.
- Use as part of the system documentation files.
- It is useful for communicating current system knowledge to the user.
Disadvantages
- DFDs show weak input and output detail.
- The user often finds it confusing initially.
Physical consideration are usually left out.
Hope you liked this article. Keep visiting Mentorway for more articles like this.